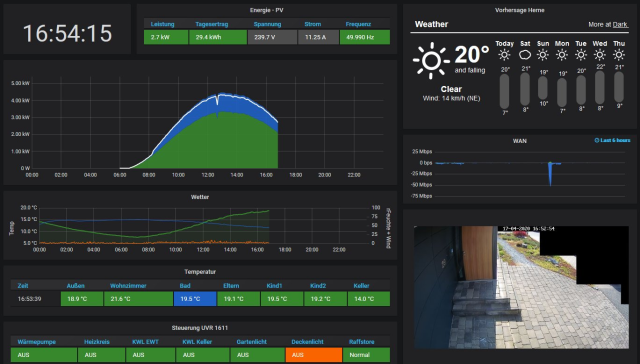
It seems that the TIG-Stack not only excels in the data center, but as a home automation UI as well – thanks to the versatile Telegraf input agent. Stock OEM display solutions often cost an arm and a leg, so I decided to build my own over a year ago. This post is about the hard- and software in use, as well as the necessary configuration to realize a useful dashboard system for your precious home.
Hardware Platform
The TIG-Stack is hosted by a little Raspberry Pi 3+ / 1GB RAM / 128Gb M.2 SSD via USB Shield, running the usual 32-Bit Raspbian. Telegraf, InfluxDB and Grafana installation is pretty straight forward, please visit my recent blogpost for details.
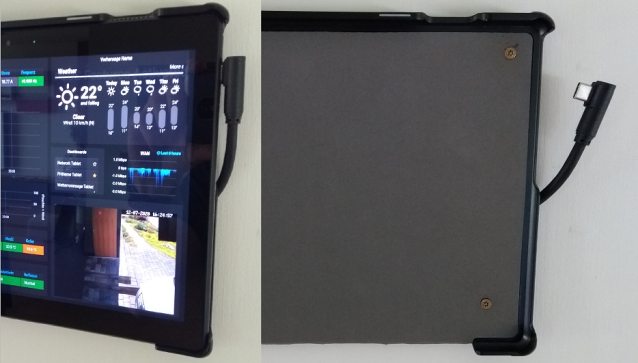
Tablet and Wall Mount
A cheap Android tablet like the Lenovo Tab M10 works fine as a display device via local WiFi. The back case of a usual tablet cover makes a decent wall mount in combination with four screws and spacer sleeves to enable a little ventilation at the back.
Fully Kiosk Browser
The Fully Kiosk Brower allows to use the maximum screen size of the tablet to display the Grafana dashboard without browser tab headers. It also provides smart features like an automatic screensaver with dimmed backlight, controlled via motion detection and a standby mode over night to save some energy.
PV Metrics
Now to the part how all the different metrics reach the InfluxDB via Telegraf, starting with the solar power system.

SBFspot
Our 10yo Inverter, an SMA SunnyBoy 5000 TL-20 doesn’t has a network interface, so Bluetooth is used to fetch the current data via SBFspot. SBFspot provides a semi-automated configuration tool sbfspot-config for the RaspberryPi platform, which has to be executed as root / pi user:
curl -s https://raw.githubusercontent.com/sbfspot/sbfspot-config/master/sbfspot-config | sudo bash So, Bluetooth (takes some time to discover the SMA Inverter) is the right connection type and with NoSQL / CSV only as Database Configuration the install will be started. Afterwards, some additional adjustments to the configuration file are necessary.
$ sudo vi /usr/local/bin/sbfspot.3/SBFspot.cfg
SunRSOffset=1800
OutputPath=/home/pi/smadata
OutputPathEvents=/home/pi/smadata/Events
CSV_ExtendedHeader=0
CSV_SaveZeroPower=0
Timezone=Europe/Berlin # Timezone of your PV plant
Latitude=52.52 # The coordinates of your PV plant
Longitude=7.21
Locale=de-DE # Localisation
DateTimeFormat=%d/%m/%Y %H:%M:%S %z # %z provides essential offset to UTC for Telegraf processing
DecimalPoint=point # Important for Telegraf to identify values as float
At this point SBFspot writes data to a .csv file in the /home/pi/smadata folder .
Telegraf Configuration
$ sudo vi /etc/telegraf/telegraf.d/SBFspot.conf
[[inputs.file]] files = ["/home/pi/smadata/PHHerne-PV-Spot*.csv"] data_format = "csv" csv_header_row_count = 1 csv_delimiter = ";" csv_timestamp_column = "dd/MM/yyyy HH:mm:ss z" csv_timestamp_format = "02/01/2006 15:04:05 -0700" csv_tag_columns = [2,3,4,12,13,15,16,18,19,22,29,30] # Optimierungspotential
$ sudo systemctl reload telegraf
[[inputs.tail]] would be another approach, but I hit some weird issues (I unfortunately not remember any more) and went the .csv path using one growing file per day.
Cron job
To clean up the working directory /home/pi/smadata/ and permanent store the event data of the inverter, I use a nightly cron job with the following configuration.
$ crontab -e 0 23 * * * mv /home/pi/smadata/PHHerne-PV-Spot*.csv /home/pi/smadata/archiv/
5 23 * * * rm /home/pi/smadata/PHHerne-PV-*.csv
Home Automation Metrics
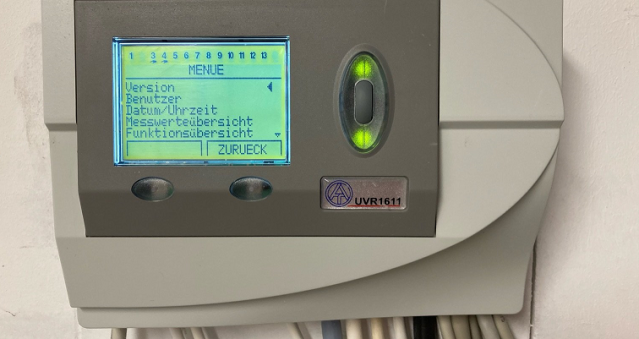
The home automation solution in place (TA UVR 1611) has a CAN bus interface and can be accompanied by a web interface gateway (TA C.M.I), which provides a simple API. This way I’m able to read all sensor data from a central point and pipe it to the InfluxDB.
Telegraf Configuration
[[inputs.http]] interval = "1m" urls = [ "http://user:[email protected]/INCLUDE/api.cgi?jsonnode=2&jsonparam=I,O,Na" ] method = "GET" timeout = "5s" data_format = "json" fieldpass = ["*Value*"] name_override = "UVR1611_metrics"
The API response, unfortunately isn’t an usual dictionary with easy to consume key:value pairs, so I use the fieldpass processor to filter for the interesting bits including the ‘Value’ keyword. Anyway, the data stored in the InfluxDB contains things like room/outside/system temperatures, humidity, wind speed and status parameters of the controlled systems like heat pump and ventilation system.
Network Metrics
This is, of course, the natural habitat of the TIG-Stack – monitoring IT infrastructure. The little home network gets polled via snmp and is allowed to send syslog messages to the TIG-pi. Feel free to visit these blog posts for detailed guidance on the necessary Telegraf configuration: Syslog and SNMP
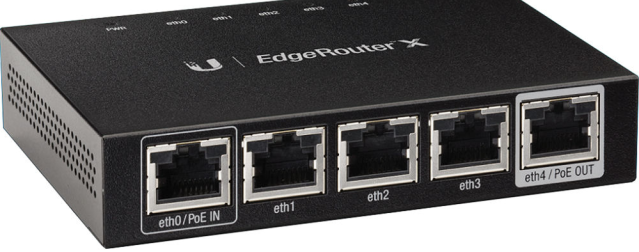
A sample Telegraf configuration file for SNMP and an Edgerouter-X would look something like this.
[[inputs.snmp]] agents = [ "172.16.0.1" ] version = 2 community = "nwmichl" interval = "60s" timeout = "10s" retries = 3 [[inputs.snmp.field]] name = "uptime" oid = "DISMAN-EXPRESSION-MIB::sysUpTimeInstance"
[[inputs.snmp.field]] name = "cpuidle" oid = ".1.3.6.1.4.1.2021.11.11.0"
[[inputs.snmp.field]] name = "memtotal" oid = "UCD-SNMP-MIB::memTotalReal.0"
[[inputs.snmp.field]] name = "memfree" oid = "UCD-SNMP-MIB::memTotalFree.0"
[[inputs.snmp.field]] name = "memshared" oid = "UCD-SNMP-MIB::memShared.0"
[[inputs.snmp.field]] name = "membuffer" oid = "UCD-SNMP-MIB::memBuffer.0"
[[inputs.snmp.field]] name = "memcache" oid = "UCD-SNMP-MIB::memCached.0" [[inputs.snmp]] agents = [ "172.16.0.1" ] version = 2 community = "nwmichl" interval = "60s" timeout = "10s" retries = 3 [[inputs.snmp.table]] name = "interface" inherit_tags = [ "hostname" ]
[[inputs.snmp.table.field]] name = "ifName" oid = "IF-MIB::ifName" is_tag = true
[[inputs.snmp.table.field]] name = "ifAlias" oid = "IF-MIB::ifAlias" is_tag = true
[[inputs.snmp.table.field]] oid = "IF-MIB::ifHighSpeed"
[[inputs.snmp.table.field]] oid = "IF-MIB::ifAdminStatus"
[[inputs.snmp.table.field]] oid = "IF-MIB::ifOperStatus"
[[inputs.snmp.table.field]] oid = "IF-MIB::ifHCInOctets"
[[inputs.snmp.table.field]] oid = "IF-MIB::ifHCOutOctets"
[[inputs.snmp.table.field]] oid = "IF-MIB::ifInDiscards"
[[inputs.snmp.table.field]] oid = "IF-MIB::ifOutDiscards"
[[inputs.snmp.table.field]] oid = "IF-MIB::ifInErrors"
[[inputs.snmp.table.field]] oid = "IF-MIB::ifOutErrors"
[[inputs.snmp.table.field]] oid = "IF-MIB::ifInUnknownProtos"
This finishes the data gathering part, the remaining topics are configuration of the Grafana dashboard itself.
Weather
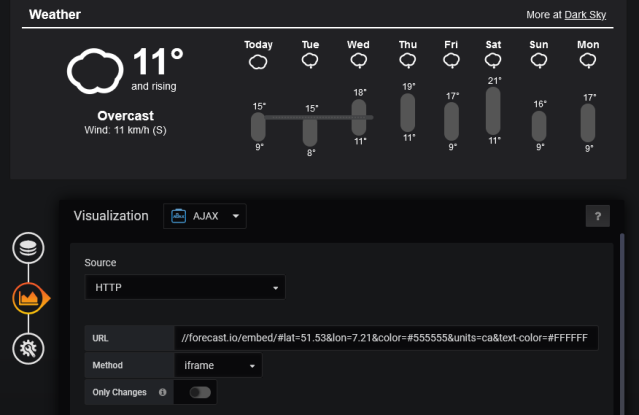
I currently use a Darksky widget to embed a visual appealing weather forecast in an AJAX iframe. Unfortunately the access might get terminated by the end of 2021 since they have been acquired by Apple. In the meantime, you should have no problem to adjust the URI to your needs, just change the latitude and longitude according to your needs.
//forecast.io/embed/#lat=51.53&lon=7.21&color=#555555&units=ca&text-color=#FFFFFF
Webcam
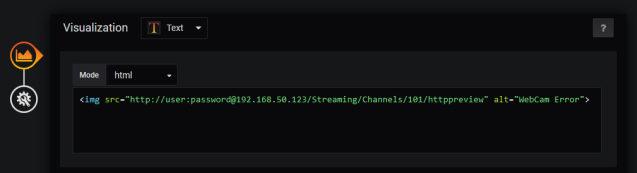
To display webcam footage, in our case the front door, it’s helpful to have a model that supports mjpeg streams. Otherwise a tool like restreamer can help to convert RSTP streams to be consumed in an HTML iframe like the Grafana text panel.
Reverse Proxy to Offload Authentication
Caveat: Depending on your web browser (Chrome?), HTML basic authentication is not allowed anymore. That’s actually a good thing, but requires more effort than necessary in a simple, private home network. In those cases an nginx reverse proxy on the RaspberryPi helps to enable unauthenticated access at the dashboard end. It forwards all requests to the webcam and takes care of the authentication.
Installation of nginx, including a full update and functional check:
$ sudo apt update
$ sudo apt full-upgrade $ sudo apt install nginx $ sudo /etc/init.d/nginx start
$ sudo systemctl status nginx.service
You can test the nginx webservice via http://RaspberryPi from any browser in your network and it should respond with this default page.

The nginx configuration file /etc/nginx/nginx.conf has to be supplemented by the following lines.
http { ## # Basic Settings ##
(...) include /etc/nginx/conf.d/*.conf; include /etc/nginx/sites-enabled/*; # # reverse proxy with authentication for webcam access # server { listen 81; listen [::]:81; root /var/www/html; index index.html index.htm index.nginx-debian.html; server_name <RaspberryPi hostname or IP>; location / { proxy_pass http://<webcam IP>:80/Streaming/Channels/101/httppreview; proxy_set_header Host $host; proxy_set_header X-Real-IP $remote_addr; proxy_set_header X-Forwarded-For $proxy_add_x_forwarded_for; proxy_set_header Authorization "Basic <user:pass base64 hashed>"; } access_log /var/log/nginx/access.log; error_log /var/log/nginx/error.log; }
}
The URL in the AJAX plugin now reduces to http://RaspberrPi:81. Thats it, the mjpeg stream should now load without authentication necessary.

Closing
I uploaded the dashboard to github, it won’t work though outside of my castle because it’s highly customized and to top it all it’s in German. But, I hope it demonstrates the possibilities of the versatile Telegraf agent combined with Grafana. It provides so many input plugins today, that I can’t imagine a situation where it doesn’t fit, especially when combining many different data sources.